
Management review shouldn’t take a fortnight.
Half the meeting prep is exporting spreadsheets from different places and pasting them into a deck that’s stale by the time it’s presented.
Assembled by hand
Someone spends days each quarter turning raw data into a picture.
Trends invisible
You can see this month, but not whether it’s better or worse than the last six.
Different numbers, same question
Two people report on incidents and get two different figures.
How it works
Pick the data, shape it, share it.
01
Choose the source
Any module — incidents, actions, audits, competency, assets, obligations.
02
Filter and group
By site, date range, category, owner or any field you’ve configured.
03
Chart it
Bar, line, pie or table. Use the blue ladder so charts read consistently.
04
Pin or schedule it
Put it on a dashboard, or email it to the leadership team monthly.
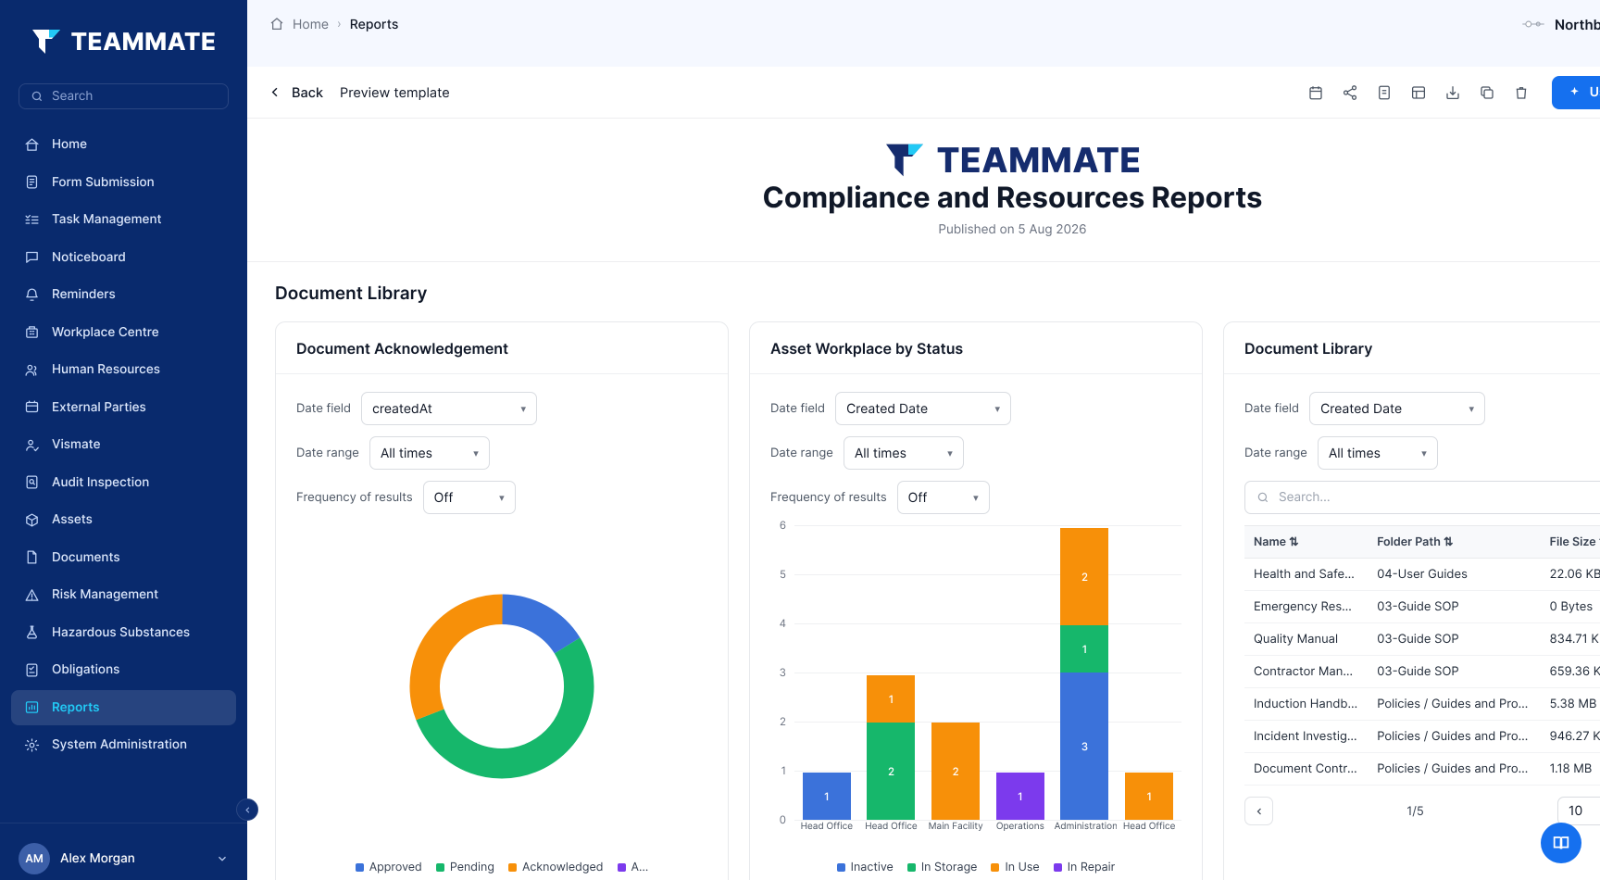
The dashboard people open on Monday.
Overdue actions, competency expiring this month, audit scores by site, incidents by type. Whatever your leadership actually asks about — on one screen, live.
- Role-aware — A site manager sees their site; the GM sees the group.
- Drill through — Click a bar and open the records behind it.
- Export clean — PDF or Excel for board papers and certification evidence.
Dashboards & reports
Every module reports into the same place.
Because incidents, audits, actions, competency and obligations already share one system, a dashboard is a view rather than an export. Nothing has to be reconciled first.
Build it yourself
Drag widgets onto a board — charts, counts, overdue lists, trend lines — and arrange them the way you read them.
A dashboard per role
The board sees trends across the group. A site manager sees this week, this site. Same data, filtered by the permissions you already set.
Reports that send themselves
Schedule the monthly pack to the people who need it, as PDF or Excel, before anyone has to ask for it.
Works with
Reporting is only as good as its inputs.
Because every module feeds the same database, a report can cross modules without anyone exporting anything.